Blog Category 2

Vis Potpourri, September 2017-Author ROBERT KOSARA

brainsplode-big

A potpourri is a collection of spices and plants that create a pleasant aroma together. This new series assembles a list of links to recently interesting things in visualization, from both information visualization (InfoVis, which I normally cover on this site) and scientific visualization (SciVis) – the latter covered by new blog collaborator and medical visualization assistant professor, Noeska Smit

The items below are an unordered mix of SciVis and InfoVis on purpose. The goal with this type of posting is not to be the all-encompassing Complete List of Everything that Andy Kirk tends to post, but to be much more selective and opinionated.

Steve Haroz has put together a great collection and analysis of Open Access papers that will be presented at the IEEE VIS conference in early October. On the oavis page, you get an interactive overview of the available PDFs, materials, data, and explanations, for each of the VIS tracks per session. Steve is handing out Open Access badges per paper, and it seems SciVis and VAST are lagging behind InfoVis quite a bit. Also check out Steve’s detailed analysis here.

Kitware’s VTK (visualization toolkit) had a new major release this summer: VTK 8.0.0. While larger updates to the rendering process were a focus in the 7.x.x series, 8.0.0 also brings improvements such as a Vertex Buffer Object cache, GPU volume texture streaming, and an improved dual depth peeling pass. Other key items in this release include the introduction of VTK-m, a Lagrangian particle tracer, a new QVTKOpenGLWidget, and improved data loading for large files.

Speaking of toolkits, Elijah Meeks has released a new data visualization framework for ReactJS, called Semiotic (here’s a nice little introduction). It’s an interesting approach to building visualizations for the web, and particularly interesting if you’re already using React. Coming from Elijah, the tagline is no surprise:

Semiotic is an opinionated framework optimized to enable effective communication through data visualization.

The Dear Data project made huge waves last year. It’s no longer just a beautiful book, Giorgia Lupi and Stefanie Posavec have just released a postcard kit to get you started on your own data correspondents project. The kit includes not just cards, but prompts and ideas for what to collect data about. This would make a great gift, say for your favorite visualization blogger.

Lisa Charlotte Rost tells a story with data about how vote counts turn into parliamentary seats in Germany. She does not use visualization, steppers, or scrollytelling, however. Instead, it’s a spreadsheet. For this kind of detailed walk-through, this is a very interesting idea, and very effective. You can see the calculations in each cell to see more detail than is in the explanation.

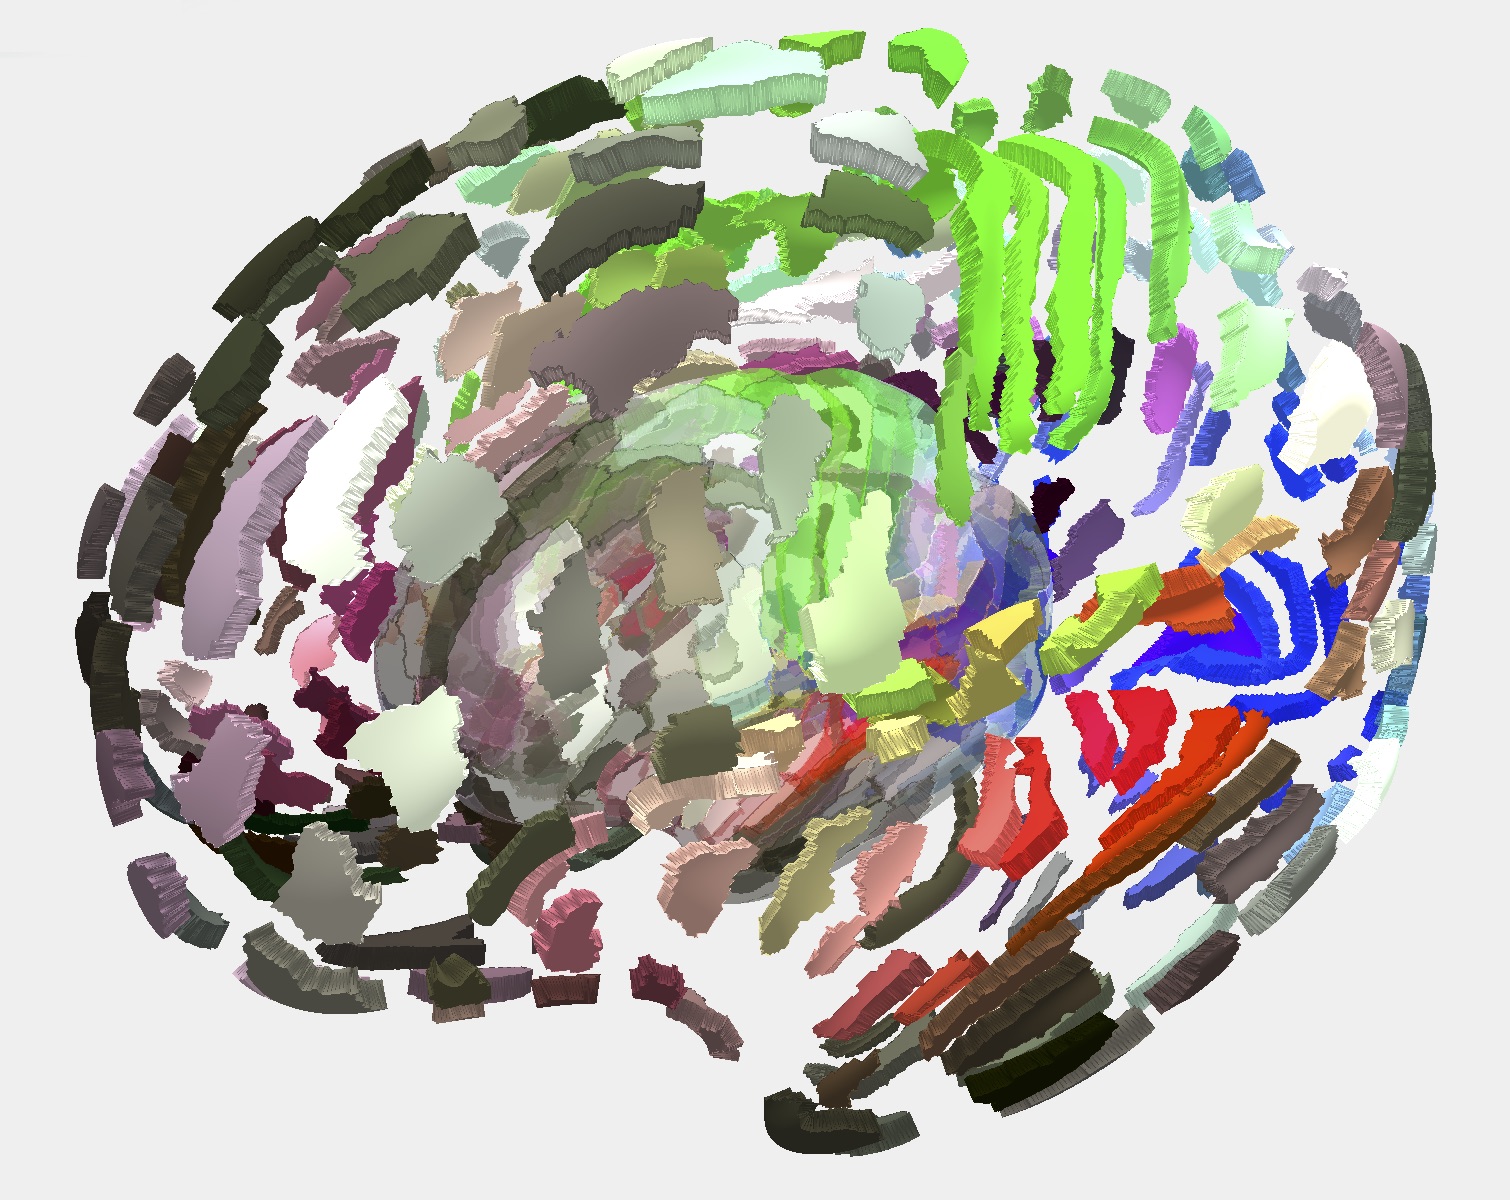
Emma Robinson has written up a great SciVis blog post on her recent work on The Cortical Explorer. She describes the features of this online brain explorer, the motivation behind it, and future plans, in an easier to digest format than you would find in a paper. You can now also play around with this brain yourself in your browser and make it explode as you see fit! I really hope to see more such blog posts in the future, because these ‘science in plain English’-type of posts can also be of great interest to a broader audience.

The short video Unendurable Line is a fascinating exercise in showing a sort of data together with the phenomenon it’s based on, plus sound, in real time. It’s impossible to explain, you have to watch it. It’s worth two minutes of your time, though, and I don’t say that lightly about videos.

And that’s a wrap for the first Vis Potpourri! Let us know if you like the format and if there’s anything you think we should change.


The Author

Robert Kosara is a Senior Research Scientist at Tableau Software and formerly Associate Professor of Computer Science at UNC Charlotte. He has created visualization techniques like Parallel Sets and performed research into the perceptual and cognitive basics of visualization. Recently, Robert’s research has focused on how to communicate data using tools from visualization, and how storytelling can be adapted to incorporate data, interaction, and visualization.

Robert received his M.Sc. and Ph.D. degrees in computer science from Vienna University of Technology (Vienna, Austria). His list of publications can be found online on his vanity website. He can be found on TwitterLinkedIn, and Google Scholar. You can also use this site’s contact form to send him an email.
What happened in the recent German election?

Karte_der_Reichstagswahlen_1912_en

Divya Schäfer writes:


 am not a statistician, but a historian by training. However, I have a lay interest in election analyses, among other topics covered in your blog.

I live in Germany. Yesterday, the federal elections were concluded, as you may have heard. I was wondering if you could share your views on it on your blog?

A bit of background: Many of the results were expected, but some were surprising. Chancellor Merkel’s party was the largest, as expected. On the other hand, particularly unexpected was the extent to which the major parties were weakened and the strong performance of small parties, particularly the radical right-wing Alternative for Germany (AfD), which ended with 12.6%. It is strongest in eastern Germany. This is seen as a reaction to Merkel’s refugee policy, but probably has deeper roots.

Germany’s overall prosperity has also meant that the Left parties have found it difficult to push their message as strongly as they would have liked. According to some graphs they showed on TV yesterday, economic concerns like employment played a smaller role for voters than in previous elections. At the same time, there are many who feel left out. The German electoral landscape has changed, and analysts have offered various explanations for this. Is this speaking too soon? Maybe these elections represent only a blip rather than a rightward shift?

Germany has a proportional representation system, explained here.

Studies of German voting behaviour have been analysed in many scholarly works, which suggest both a generational effect as well as a life-cycle effect (sorry, I could not find English language resources for this). I think this has something to do with the proportional representation system. German voters change their choices from election to election more often than American voters, a phenomenon known as “Wählerwanderung”. This article (link here) from the Financial Times has some nice graphs on the German elections.

We see, for instance (based on fairly accurate exit polls), that the AfD has taken votes from all sorts of sources. Mostly it has mobilised non-voters, but has also taken substantial chunks from the CDU/CSU (Conservatives, also Merkel’s faction) and the SPD (Social Democrats). Even the Linke (Left Party) has lost as much as 11% of its voters to the radical right-wing party.

I have no idea; I know nothing about German politics beyond what I read in the newspapers. But it can be a good idea to blog on things I know nothing about. So feel free to comment, everyone!

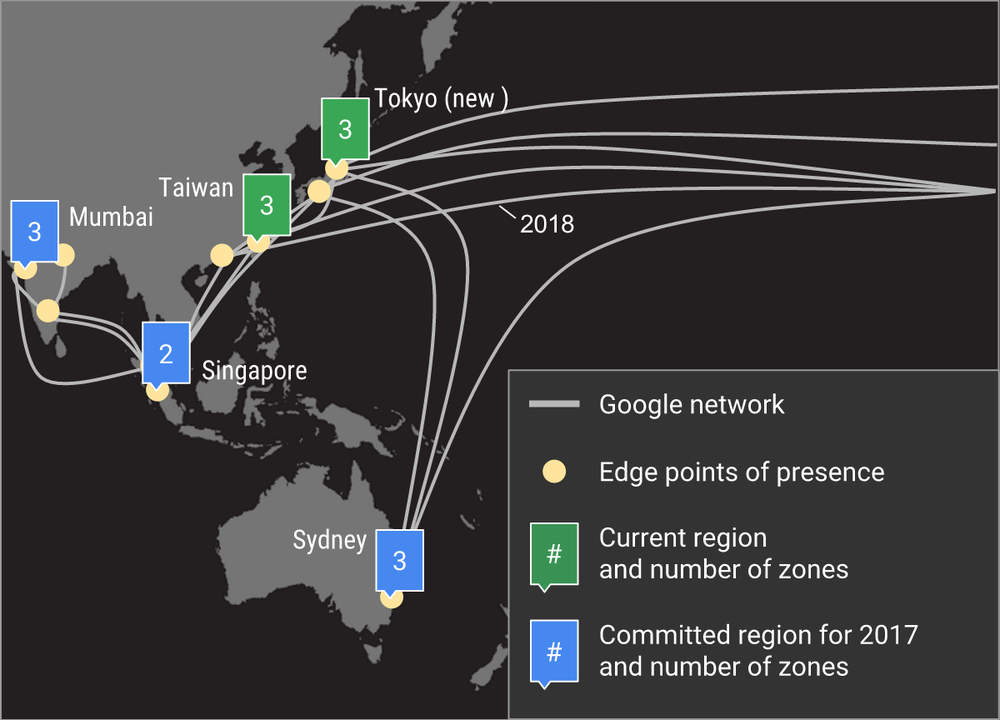
Google is transforming Japanese business

tokyo-region-ga.width-1000

Google invited 13000 programmers and to its largest Asia pacific cloud event.

Google Cloud Next Tokyo. During this event, we celebrated the many ways that Japanese companies such as Kewpie, Sony (and even cucumber farmers) have transformed and scaled their businesses using Google Cloud.

Since the launch of the Google Cloud Tokyo region last November, roughly 40 percent of Google Compute Engine core hour usage in Tokyo is from customers new to Google Cloud Platform (GCP). The number of new customers using Compute Engine has increased by an average of 21 percent monthly over the last three months, and the total number of paid customers in Japan has increased by 70 percent over the last year.

By supplying compliance statements and documents for FISC — an important Japanese compliance standard — for both GCP and G Suite, we’re making it easier to do business with Google Cloud in Japan.

Here are a few of the exciting announcements that came out of Next Tokyo:

Retailers embracing enterprise innovation

One of the biggest retailers in Japan, FamilyMart, will work with Google’s Professional Services Organization to transform the way it works, reform its store operations, and build a retail model for the next generation. FamilyMart is using G Suite to facilitate a collaborative culture and transform its business to embrace an ever-changing landscape. Furthermore, it plans to use big data analysis and machine learning to develop new ways of managing store operations. The project, — dubbed “Famima 10x” — kicks off by introducing G Suite to facilitate a more flexible work style and encourage a more collaborative, innovative culture.

Modernizing food production with cloud computing, data analytics and machine learning

Kewpie, a major food manufacturer in Japan famous for their mayonnaise, takes high standards of food production seriously. For its baby food, it used to depend on human eyes to evaluate 4 – 5 tons of food materials daily, per factory, to root out bad potato cubes — a labor-intensive task that required intense focus on the production line. But over the course of six months, Kewpie has tested CloudMachine Learning Engine and TensorFlow to help identify the bad cubes. The results of the tests were so successful that Kewpie adopted the technology.

Empowering employees to conduct effective data analysis

Sony Network Communications Inc. is a division of Sony Group that develops and operates cloud services and applications for Sony group companies. It converted from Hive/Hadoop to BigQuery and established a data analysis platform based on BigQuery, called Private Data Management Platform. This not only reduces data preparation and maintenance costs, but also allows a wide range of employees — from data scientists to those who are only familiar with SQL — to conduct effective data analysis, which in turn made its data-driven business more productive than before.

Collaborating with partners

During Next Tokyo, we announced five new Japanese partners that will help Google Cloud better serve customers.

  • NTT Communications Corporation is a respected Japanese cloud solution provider and new Google Cloud partner that helps enterprises worldwide optimize their information and communications technology environments. GCP will connect with NTT Communications’ Enterprise Cloud, and NTT Communications plans to develop new services utilizing Google Cloud’s big data analysis and machine intelligence solutions. NTT Communications will use both G Suite and GCP to run its own business and will use its experiences to help both Japanese and international enterprises.
  • KDDI is already a key partner for G Suite and Chrome devices and will offer GCP to the Japanese market this summer, in addition to an expanded networking partnership.
  • Softbank has been a G Suite partner since 2011 and will expand the collaboration with Google Cloud to include solutions utilizing GCP in its offerings. As part of the collaboration, Softbank plans to link GCP with its own “White Cloud” service in addition to promoting next-generation workplaces with G Suite.
  • SORACOM, which uses cellular and LoRaWAN networks to provide connectivity for IoT devices, announced two new integrations with GCP. SORACOM Beam, its data transfer support service, now supports Google Cloud IoT Core, and SORACOM Funnel, its cloud resource adapter service, enables constrained devices to send messages to Google Cloud Pub/Sub. This means that a small, battery-powered sensor can keep sending data to GCP by LoRaWAN for months, for example.

Create Cloud Spanner instances in Tokyo

Cloud Spanner is the world’s first horizontally-scalable and strongly-consistent relational database service. It became generally available in May, delivering long-term value for our customers with mission-critical applications in the cloud, including customer authentication systems, business-transaction and inventory-management systems, and high-volume media systems that require low latency and high throughput. Starting today, customers can store data and create Spanner instances directly in our Tokyo region.

Jamboard coming to Japan in 2018

At Next Tokyo, businesses discussed how they can use technology to improve productivity, and make it easier for employees to work together. Jamboard, a digital whiteboard designed specifically for the cloud, allows employees to sketch their ideas whiteboard-style on a brilliant 4k display, and drop images, add notes and pull things directly from the web while they collaborate with team members from anywhere. This week, we announced that Jamboard will be generally available in Japan in 2018.

Why Japanese companies are choosing Google Cloud

For Kewpie, Sony and FamilyMart, Google’s track record building secure infrastructure all over the world was an important consideration for their move to Google Cloud. From energy-efficient data centers to custom servers to custom networking gear to a software-defined global backbone to specialized ASICs for machine learning, Google has been living cloud at scale for more than 15 years—and we bring all of it to bear in Google Cloud.

We hope to see many of you as we go on the road to meet with customers and partners, and encourage you to learn more about upcoming Google Cloud events.

Page 1 of 212

BLOG POSTS

ADDRESS

650 Parliament Street, Toronto,Ontraio, Canada
Phone: (416) 939-0044
Fax: (647) 720-2214
Website: http://www.datajadoo.com
Email: info@datajadoo.com

DISCLAIMER

Important:: This site has been setup purely for showcasing the analytic's skills of Data Jadoo. All the content are designed by Data Jadoo. Author retains his or her views on the topics expressed here. All images are copyrighted to their respective creators.