Everyday Data Jadoo Big Data Blog

2 Key Lessons From Facebook’s Video Views Metrics Fiasco Read more: 2 Key Lessons From Facebook’s Video Views Metrics Fiasco – Digital Marketing and Analytics by Anil Batra

facebook-video-views


2 Key Lessons From Facebook’s Video Views Metrics Fiasco

People have short term memory (or selective memory), when they can’t remember things they will resort to how they think something should be. Recently Facebook was in the hot seat because of this very reason.

Facebook metrics definition issue

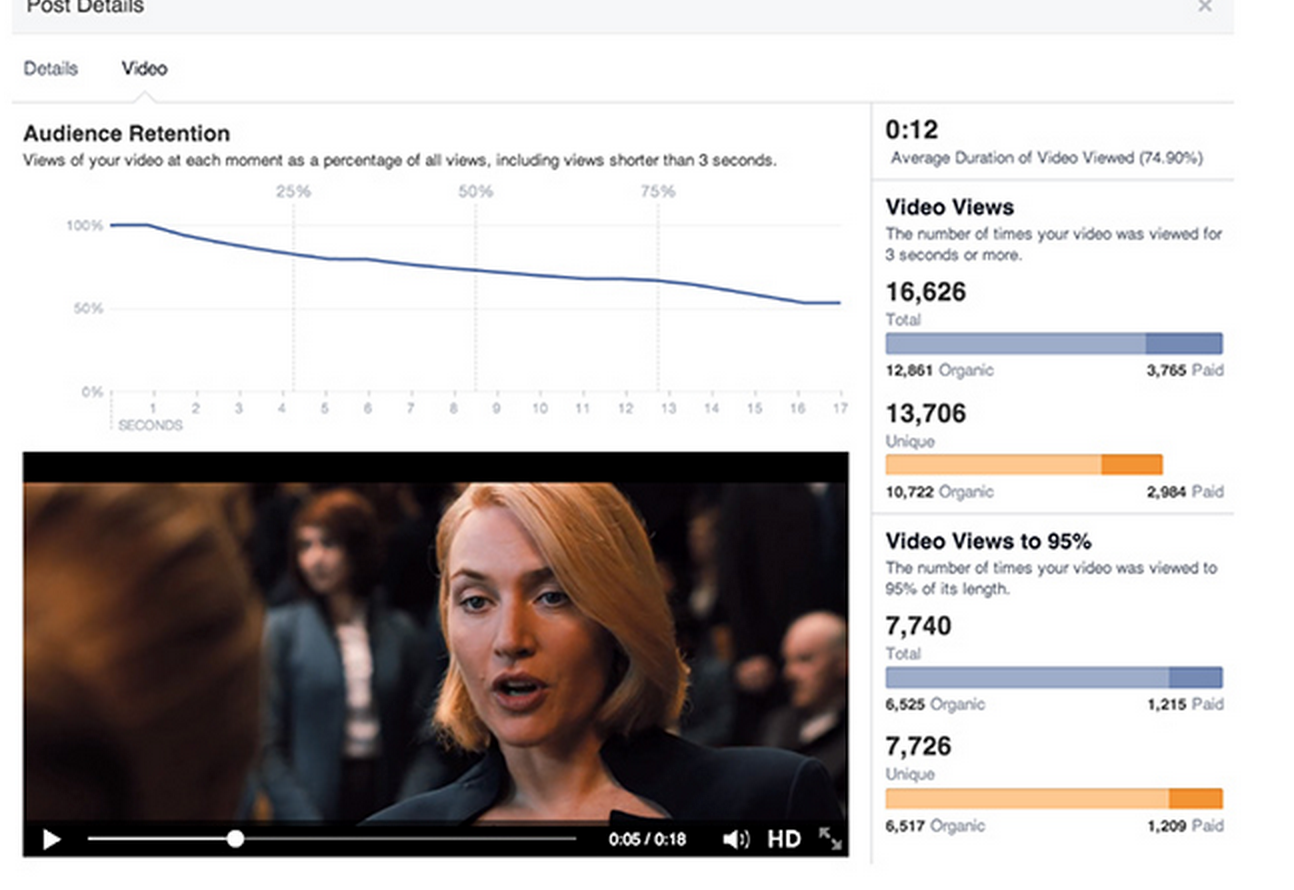
Facebook has a metrics called “Video View” for video ads.  In this metric they only counted the video as viewed if it was watched more than 3 seconds by the viewer.  In other words, if someone watches a video for 2 seconds then that video view won’t be counted as a view in this metric.

Facebook also has another metrics, called “Average duration of Video views”, the “standard” definition of it should be Total Time spent watching video divided by Total Viewers. However, that’s not how Facebook defined it.  In Sept Wall Street Journal reported that Facebook “vastly overestimated average viewing time for video ads on its platform for two years.”  This lead to an apology from Facebook

About a month ago, we found an error in the way we calculate one of the video metrics on our dashboard – average duration of video viewed. The metric should have reflected the total time spent watching a video divided by the total number of people who played the video. But it didn’t – it reflected the total time spent watching a video divided by only the number of “views” of a video (that is, when the video was watched for three or more seconds). And so the miscalculation overstated this metric. While this is only one of the many metrics marketers look at, we take any mistake seriously.

As per DM News article, Facebook did state the definition when it rolled out this metric two years ago.  So it was not actually doing anything wrong.  It was a case of short term memory issue.

“The problem, as critics put it, is a problem of omission. While Facebook very clearly states that it’s only counting views as any video-play event that lasts longer than three seconds, it does not go out of its way to explicitly beat readers over the head with the fact that this definition of a “video view” applies equally to the calculation of average duration of video views.”

If Facebook product team had read my posts from 2012 on “Creating a culture of analytics” then they might have likely avoided this “scandal”. The two issues that Facebook dealt with were the exact same ones I talked about in my posts. To recap, here are the gist of those two posts:

Lack of standard definitions for the metrics causes people to report different numbers for supposedly same metrics, leading to confusion and total lack of trust in data.  No trust in data means that nobody is going to use the data to make strategic decisions and there goes all your efforts to create a culture of Analytics.

Having standard definitions is not as easy as it sounds.  It starts from you and your team having a clear understanding on how to calculate various metrics.   Some seemingly simple metrics can be calculated in various different ways and all of those ways might be right but getting one standard way of calculating those removes any confusion and gets everybody on the same page.

  • People have short term memory.  In my 2012 post, titled  Dealing with Short-Term Memory: Creating a Culture of Analytics,  I wrote:We all make assumptions from time to time; sometime we state them clearly and sometimes we just assume in our own head. We then operate under those assumptions.  In context of Analytics, one such assumption is that everybody knows what the goals and KPIs are.  We might have defined them on the onset of the program, campaign, beginning of month, quarter, year etc., but once those are defined we start to assume that everybody knows about them and is operating keeping those goals in mind.

    Well the truth is that people have short term memory. They do forget and then start to interpret the KPIs, defined based on those goals, in their own way.  As the Analytics head/analyst/manager, it is your job to constantly remind stakeholders of the goals and KPIs.

Two Lessons

This fiasco provides two great lesson for all the Digital Analytics teams.

  1. Clearly define your metrics and make sure the underlying metrics and calculations are clear in your definition.
  2. Don’t make any assumptions, people have short term memory. Just because you stated a definition of a KPI in past does not mean everybody will remember it and know how tit was calculated. It is your job to make sure anybody using your metrics/KPI can get to the definition and calculations right away.


11 Tips for Improving Customer Experience and Driving Conversions

photo_65410_20160427


Struggling to drive conversions?  The issue might be with customer experience. After having worked with several brands, big and small, I can assure you that you don’t have to make sweeping changes to drive better results. Many times even small changes and little bit process can lead to happy customers and big impacts. In this post I have complied 11 tips that you can use today. If you need help then don’t hesitate to reach out to me.

  1. Easy to fill forms – How many times have you come across a form field where you don’t remember what the field was about?  Many designers/developers use the default text in the form filed as the filed label. Once you tab into that field, the default text is gone and now you can’t figure out what that field was about.  That is a very bad design which will likely cause customer frustration and kill conversions.
  2. No more unnecessary form field formatting and validations – Other than Captcha validation, you are likely using form field validations in your online form to make sure visitors/customers enter the correct data.  You might also use validation to ensure that the format of the data fields such as email, phone, etc. is correct. Many of these validations are absolutely required to ensure data quality. However, some validations put unnecessary burden on your customer/visitor leading them to abandon your forms/checkout process. A lot of data formatting can be done via client side JavaScript or backend processing without putting the customer through a lot of pain. So go through your own forms, see if all form validations are absolutely required. If not, then remove them, also remove any validation/formatting requirements that you can handle via code in the front end or backend. Check out my post on Form validation and conversions.
  3. No more convoluted captcha – Captcha are great to stop the spammers, bots and spiders from filling the forms, but some Captchas are so bad that they not only create a undesirable customer experience but also kill the conversions. Make sure you critically evaluate the captcha on your site and if it seems like something you yourself don’t want to encounter on another site then kill it. I wrote a blog post on Captcha, you can read it at  Is CAPTACH eating up your conversions 
  4. Easy Promotional Code and Discount Code redemption – Promotional Codes also known as Promo Codes, Discount Codes, Coupon Codes, Offer codes etc, are supposed to drive sales, right? However, they can have a reverse action and can actually kill your conversions, if not properly used.  In my post “Promotional Codes: Conversion Killers?, I showed one such example where Promo codes can hinder conversions.  If you are going to announce a promotional code on your site, in a ad etc. and you know that the customer clicked on the link to arrive to your site then go ahead and automatically apply the relevant promo code don’t make a customer think and take extra steps.  Godaddy is a great example of a site the automatically apply any relevant promo codes.
  5. Consistent experience across devices – Customers expect consistent experience across browsers and devices so don’t mess with their expectations.  Broken experience can lead to customer dissatisfaction and defection. I wrote about one such example in my post, 2 A/B Testing Lessons Learned from Amazon Video.  Read more: 2 A/B Testing Lessons Learned from Amazon Video
  6. Easy to find customer support number  – Yes, phone support is expensive but bad customer experience is even more expensive.  If you do your cost analysis, you might find that phone support is actually profitable. A phone call provide you an opportunity to hear your customer and convert a dissatisfied customer into a satisfied customers. Make it easy for customers to contact you rather than complain on social media.
  7. Connected Channels, Customer Service, Support and Marketing – If I get a marketing material and I call the number listed on that then person picking up the phone on the other end should be able to answer question on that material. I have several experiences where customer support is not in sync with the marketing and customer has to waste his/her time. I talked about one such case of disconnected experience in my blog post titled, Are you Optimizing the Wrong Steps of the Conversion Process?
  8. Easy to Find subscription cancellation link – Have you ever tried to cancel a paid App subscription on iPhone?  It is pretty bad. I always forget where the link is and have to spend several minutes to look for it. Not a good experience.  It might work for iPhone and Apple but likely won’t work for you. If customer wants to cancel a subscription, then go ahead and make it easy for them to find the cancellation button/links. I am not saying you let them go easily, you should have top notch experience, service etc, to make it hard for them cancel but hiding an option to cancel is not the solution.  If they can’t find that cancellation link the they are going to leave you bad reviews about you in social media. Use data to figure out how valuable the customer is, understand why he/she is leaving and provide proper personalized offer/incentive for them to stay.
  9. Easy to Unsubscribe from emails and other communications – Don’t end up in spam folders because your subscribers can’t find an unsubscribe link in your email. Spam complain will hurt more than the unsubscribes. If you do send relevant messages then unsubscribe should not be a big issue because people only unsubsribe from irrelevant stuff. Follow email best practices, send relevant messages and provide a link to unsubscribe.
  10. Ongoing Testing – Customer preferences change, their behavior changes and you site has to change to. The best way to change your site is to keep evolving and always trying to find out what works best for your customers. This is where ongoing testing (A/B testing, MVT testing) helps. Before rolling out a feature, page layout etc., test it and see if your customers like it.  If not, then try something else. As Bryan Eisenberg says “Always Be Testing”.
  11. Personalized experience I started writing about personalization ever since I started this blog, back in 2006. I wrote extensively about privacy and how marketers should address it to engage in personalization. Consumers are now more at ease with online purchases, they have moved past initial privacy concerns of online tracking and now expect personalization.  Personalization is no longer optional. Many marketers don’t realize that personalization does not have to be complex. You can start simple and build on it.  Reach out to me if you need help.


Read more: http://webanalysis.blogspot.com/2017/02/11-tips-for-improving-customer.html#ixzz4oQLWbBj3

Not all forecasters got it wrong: Nate Silver does it again (again)

By Rafa Irizarry
Share this on → Twitter | Facebook | Google+
Four years ago we posted on Nate Silver’s, and other forecasters’, triumph over pundits. In contrast, after yesterday’s presidential election, results contradicted most polls and data-driven forecasters, several news articles came out wondering how this happened. It is important to point out that not all forecasters got it wrong. Statistically speaking, Nate Silver, once again, got it right.

To show this, below I include a plot showing the expected margin of victory for Clinton versus the actual results for the most competitive states provided by 538. It includes the uncertainty bands provided by 538 in this site (I eyeballed the band sizes to make the plot in R, so they are not exactly like 538’s).
datajadooelection

Note that if these are 95% confidence/credible intervals, 538 got 1 wrong. This is exactly what we expect since 15/16 is about 95%. Furthermore, judging by the plot here, 538 estimated the popular vote margin to be 3.6% with a confidence/credible interval of about 5%. This too was an accurate prediction since Clinton is going to win the popular vote by about 1% 0.5% (note this final result is in the margin of error of several traditional polls as well). Finally, when other forecasters were giving Trump between 14% and 0.1% chances of winning, 538 gave him about a 30% chance which is slightly more than what a team has when down 3-2 in the World Series. In contrast, in 2012 538 gave Romney only a 9% chance of winning. Also, remember, if in ten election cycles you call it for someone with a 70% chance, you should get it wrong 3 times. If you get it right every time then your 70% statement was wrong.

So how did 538 outperform all other forecasters? First, as far as I can tell they model the possibility of an overall bias, modeled as a random effect, that affects every state. This bias can be introduced by systematic lying to pollsters or under sampling some group. Note that this bias can’t be estimated from data from one election cycle but it’s variability can be estimated from historical data. 538 appear to estimate the standard error of this term to be about 2%. More details on this are included here. In 2016 we saw this bias and you can see it in the plot above (more points are above the line than below). The confidence bands account for this source of variabilty and furthermore their simulations account for the strong correlation you will see across states: the chance of seeing an upset in Pennsylvania, Wisconsin, and Michigan is not the product of an upset in each. In fact it’s much higher. Another advantage 538 had is that they somehow were able to predict a systematic, not random, bias against Trump. You can see this by comparing their adjusted data to the raw data (the adjustment favored Trump about 1.5 on average). We can clearly see this when comparing the 538 estimates to The Upshots’:

datajadoo-election-results

Page 3 of 1212345...10...Last »

BLOG POSTS

ADDRESS

650 Parliament Street, Toronto,Ontraio, Canada
Phone: (416) 939-0044
Fax: (647) 720-2214
Website: http://www.datajadoo.com
Email: info@datajadoo.com

DISCLAIMER

Important:: This site has been setup purely for showcasing the analytic's skills of Data Jadoo. All the content are designed by Data Jadoo. Author retains his or her views on the topics expressed here. All images are copyrighted to their respective creators.