Archive for December 2016

Not all forecasters got it wrong: Nate Silver does it again (again)

By Rafa Irizarry
Share this on → Twitter | Facebook | Google+
Four years ago we posted on Nate Silver’s, and other forecasters’, triumph over pundits. In contrast, after yesterday’s presidential election, results contradicted most polls and data-driven forecasters, several news articles came out wondering how this happened. It is important to point out that not all forecasters got it wrong. Statistically speaking, Nate Silver, once again, got it right.

To show this, below I include a plot showing the expected margin of victory for Clinton versus the actual results for the most competitive states provided by 538. It includes the uncertainty bands provided by 538 in this site (I eyeballed the band sizes to make the plot in R, so they are not exactly like 538’s).
datajadooelection

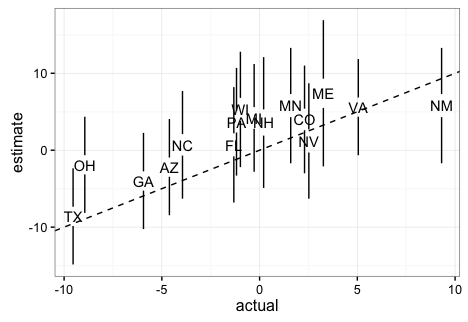
Note that if these are 95% confidence/credible intervals, 538 got 1 wrong. This is exactly what we expect since 15/16 is about 95%. Furthermore, judging by the plot here, 538 estimated the popular vote margin to be 3.6% with a confidence/credible interval of about 5%. This too was an accurate prediction since Clinton is going to win the popular vote by about 1% 0.5% (note this final result is in the margin of error of several traditional polls as well). Finally, when other forecasters were giving Trump between 14% and 0.1% chances of winning, 538 gave him about a 30% chance which is slightly more than what a team has when down 3-2 in the World Series. In contrast, in 2012 538 gave Romney only a 9% chance of winning. Also, remember, if in ten election cycles you call it for someone with a 70% chance, you should get it wrong 3 times. If you get it right every time then your 70% statement was wrong.

So how did 538 outperform all other forecasters? First, as far as I can tell they model the possibility of an overall bias, modeled as a random effect, that affects every state. This bias can be introduced by systematic lying to pollsters or under sampling some group. Note that this bias can’t be estimated from data from one election cycle but it’s variability can be estimated from historical data. 538 appear to estimate the standard error of this term to be about 2%. More details on this are included here. In 2016 we saw this bias and you can see it in the plot above (more points are above the line than below). The confidence bands account for this source of variabilty and furthermore their simulations account for the strong correlation you will see across states: the chance of seeing an upset in Pennsylvania, Wisconsin, and Michigan is not the product of an upset in each. In fact it’s much higher. Another advantage 538 had is that they somehow were able to predict a systematic, not random, bias against Trump. You can see this by comparing their adjusted data to the raw data (the adjustment favored Trump about 1.5 on average). We can clearly see this when comparing the 538 estimates to The Upshots’:

datajadoo-election-results

Similarities and difference in Web and Digital Analytics

Web Analytics and Digital Analytics are quite often used interchangeably. I have been asked, by my students and some clients, about the difference in these two, so I decided to write this short post to clarify the terms.

As you can see from the Google Trends graph, Google searches for “Digital Analytics” were nonexistent till Web Analytics Association changed its name to Digital Analytics Association. Since then the term “Digital Analytics” has started to pick up.

Read more: Digital Marketing and Analytics by Anil Batra http://webanalysis.blogspot.com/#ixzz4Rhbn8hu8

digital-analytics

In early days of internet, companies started to analyze website data such as users, visitors, visits, page views etc. and the term used to describe this analysis was called “ Web Analytics”.

Then came other forms of online (digital channels) such as email, search, social, mobile etc. and increasingly Digital Analytics folks were including this data and analysis of all these channels to provide a complete view of the “Digital” channels, marketing and customers. To fully include the scope of work of “Web Analysts” a new term “Digital Analytics” was coined.

“Web Analytics” companies like WebTrends, Omniture (now Adobe), Google Analytics etc. also started including data from other online channels and transformed from Web Analytics tools to Digital Analytics tools.

When I was on the board of “Web Analytics Association” from 2009 – 2011, we had several discussions regarding the name of the association. The general consensus was that our members were doing much more than traditional “Web Analytics” and association needs to change the name and scope to include the changing role of “Web Analytics”. Association finally changed the name to “Digital Analytics Association” on March 5th, 2012.

So back to the original question – What is the difference between Web Analytics and Digital Analytics?

Web Analytics is analysis of the website data.

Digital Analytics includes analysis of data from all digital channels that includes websites. Data from search, display advertising, social, email, mobile etc. is included to provide a complete view of the digital marketing and customers.

Though usage of Digital Analytics is picking up, “Web Analytics” is still searched more often than “Digital Analytics” as shown in the following Google Trends chart

web-analytics-vs-digital-analytics

BLOG POSTS

ADDRESS

650 Parliament Street, Toronto,Ontraio, Canada
Phone: (416) 939-0044
Fax: (647) 720-2214
Website: http://www.datajadoo.com
Email: info@datajadoo.com

DISCLAIMER

Important:: This site has been setup purely for showcasing the analytic's skills of Data Jadoo. All the content are designed by Data Jadoo. Author retains his or her views on the topics expressed here. All images are copyrighted to their respective creators.